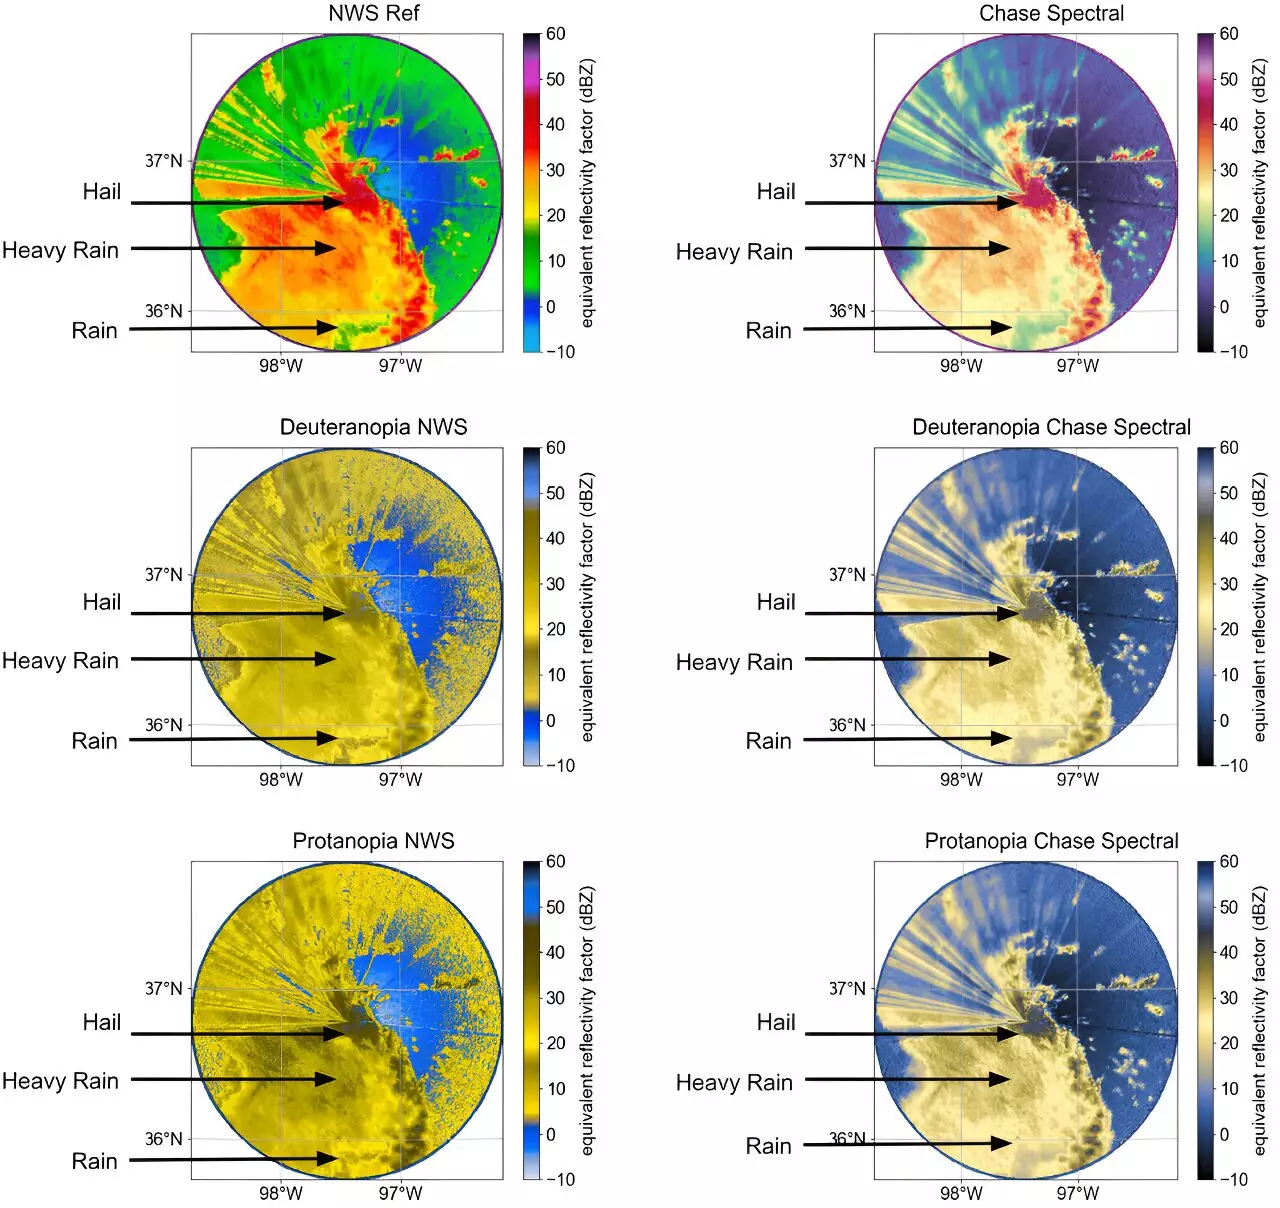
Color Vision Deficiency (CVD), also known as color blindness, affects a significant percentage of the population, including nearly 8% of genetic males and 0.5% of genetic females. In the field of meteorology, where accurate interpretation of data is crucial, the use of color to convey information poses challenges for individuals with CVD. These challenges are especially prevalent in the weather radar community, where scientists rely on color maps to analyze radar reflectivity and storm intensity. The inability to distinguish between certain colors can hinder the accurate interpretation of weather data, potentially impacting public safety.
Traditional colormaps used in meteorology often do not take into account the needs of individuals with CVD. These colormaps may feature colors that are difficult for individuals with CVD to differentiate, leading to potential misinterpretation of weather data. Moreover, many existing colormaps are not perceptually uniform, which can create artificial structures and make it challenging to accurately represent data. As a result, there is a growing need for the development of CVD-friendly colormaps in meteorology that are both accessible to individuals with CVD and optimized for data visualization.
Recognizing the importance of addressing the needs of individuals with CVD in the meteorology community, researchers from the U.S. Department of Energy’s Argonne National Laboratory have undertaken efforts to create CVD-friendly colormaps for weather radar applications. By leveraging Python programming language tools, the researchers have developed colormaps that prioritize accessibility and inclusivity. These new colormaps, such as Ze and velocity colormaps, aim to provide a more interpretable and user-friendly alternative to traditional colormaps.
Through extensive testing and collaboration with the CVD community, the researchers have found that the new CVD-friendly colormaps are more interpretable and inclusive compared to default colormaps currently in use. By making these colormaps available in open-source radar software packages and engaging with the broader meteorology community, the researchers have fostered a culture of inclusivity and accessibility in scientific visualization. The positive feedback and support from users have underscored the significance of creating colormaps that cater to the diverse needs of individuals with CVD.
Looking ahead, the research team plans to continue developing additional CVD-friendly colormaps and expanding outreach efforts to build a global community practice around inclusive scientific visualization. By equipping the next generation of meteorologists with CVD-friendly tools and resources, the researchers aim to create a more inclusive and accessible environment for all individuals in the meteorology community. Ultimately, the adoption of CVD-friendly colormaps in meteorology will not only benefit individuals with CVD but also contribute to more effective and equitable scientific visualization practices for the entire field of meteorology.


Leave a Reply